

- Topic
69k Popularity
43k Popularity
37k Popularity
16k Popularity
76k Popularity
- Pin
- 🎉 The #CandyDrop Futures Challenge# is live — join now to share a 6 BTC prize pool!
📢 Post your futures trading experience on Gate Square with the event hashtag — $25 × 20 rewards are waiting!
🎁 $500 in futures trial vouchers up for grabs — 20 standout posts will win!
📅 Event Period: August 1, 2025, 15:00 – August 15, 2025, 19:00 (UTC+8)
👉 Event Link: https://www.gate.com/candy-drop/detail/BTC-98
Dare to trade. Dare to win. - 📢 Gate Square Exclusive: #WXTM Creative Contest# Is Now Live!
Celebrate CandyDrop Round 59 featuring MinoTari (WXTM) — compete for a 70,000 WXTM prize pool!
🎯 About MinoTari (WXTM)
Tari is a Rust-based blockchain protocol centered around digital assets.
It empowers creators to build new types of digital experiences and narratives.
With Tari, digitally scarce assets—like collectibles or in-game items—unlock new business opportunities for creators.
🎨 Event Period:
Aug 7, 2025, 09:00 – Aug 12, 2025, 16:00 (UTC)
📌 How to Participate:
Post original content on Gate Square related to WXTM or its
Analyst predicts Bitcoin price for Q4
A historical price comparison between Bitcoin (BTC) and gold suggests that the cryptocurrency could rally by 35% in the fourth quarter.
Notably, Analysis by Ted Pillows projects a major upward move for Bitcoin, suggesting the digital asset could mirror gold’s historical breakout pattern. If the analogy holds, BTC may trade above $160,000 by Q4, he said in an X post on July 26.
AnalysisThe comparison draws on Analysis of gold and Bitcoin’s market behavior, identifying phases of accumulation, distribution, and re-accumulation before each asset entered a strong rally.
Analysis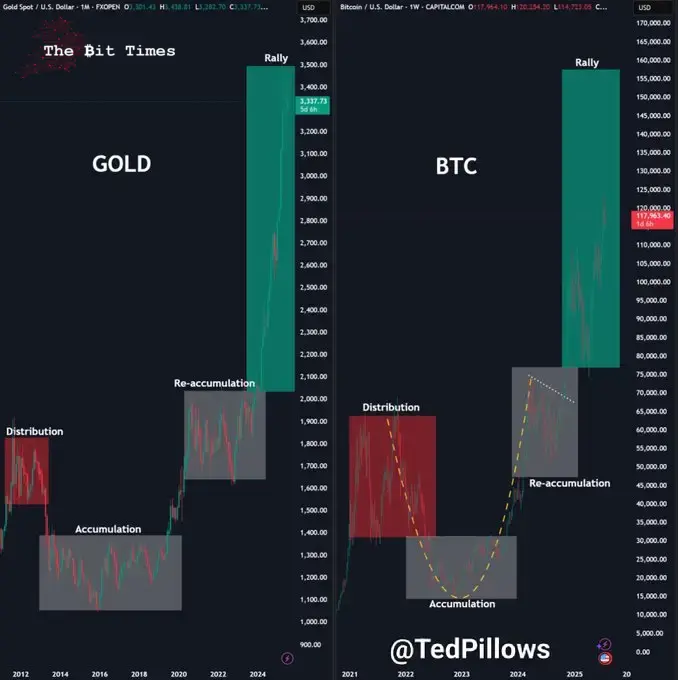 Gold and Bitcoin price analysis. Source: Ted Pillows**Gold and Bitcoin price analysis. Source: Ted PillowsNotably, gold’s rally, from under $2,000 to over $3,300, followed a prolonged re-accumulation phase. According to Pillows, Bitcoin appears to be nearing the end of a similar structure.
The analyst suggested Bitcoin’s market cycle is currently transitioning from re-accumulation to a rally phase. This final leg could significantly push the cryptocurrency’s price higher, potentially exceeding $160,000 before year-end.
It’s worth noting that in 2025, gold has delivered a standout performance as investors turned to the precious metal for its safe-haven appeal amid growing concerns over a potential economic downturn.
There is indeed potential for Bitcoin to reach these levels, especially as some analysts argue that holding key technical indicators will be crucial to its success. For instance, as reported by Finbold, crypto trading expert Ali Martinez noted that as long as Bitcoin holds above the $110,000 spot level, there is room to reach a new all-time high at $130,000.
Bitcoin price analysis
As of press time, Bitcoin was valued at $118,216, posting modest gains of less than 0.1% in the past 24 hours. Over the last seven days, however, BTC is down 0.45%.
The 14-day Relative Strength Index (RSI) stands at 60.43, indicating that the market is approaching overbought conditions but has not yet reached them.
Featured image via Shutterstock
Featured image via ShutterstockFeatured image via Shutterstock